
Simple Dashboards
Eclipse supports simple dashboard reporting in the Eclipse Admin portal where tenants can easily add graphical dashboards to visualise their tenant data. The dashboard source can be any Eclipse Report - the only requirement for displaying the report as a dashboard is that the report includes 2 results: a value and a label for the value. For example here is a query to return a breakdown of wallet types on a tenant:
SELECT COUNT(w.wallet_id) AS value, wt.name as label FROM wallet w JOIN wallet_type wt on w.wallet_type_id = wt.wallet_type_id WHERE wt.tenant_id = <tenantId> AND w.status = 1 GROUP BY label;
Eclipse includes standard dashboard reports that can be used to create dashboards. If you would like to add new dashboard reports please get in touch with your account representative.
Dashboards can be generated from within the Eclipse Admin Portal under the Dashboards section:
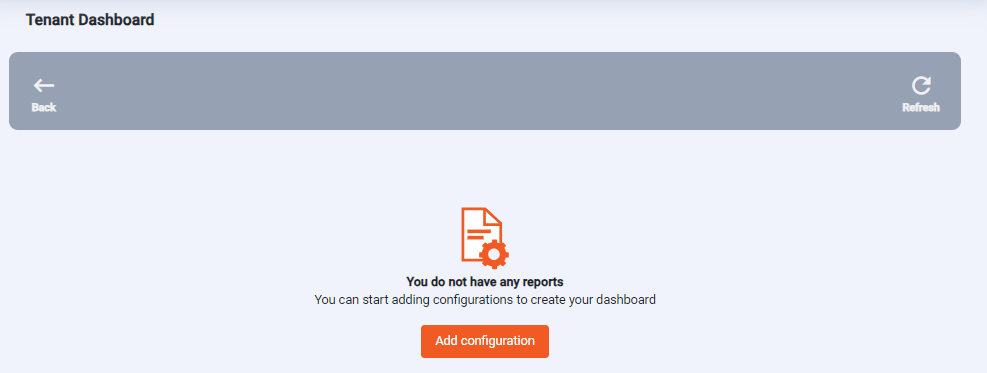
Add Dashboard Configuration
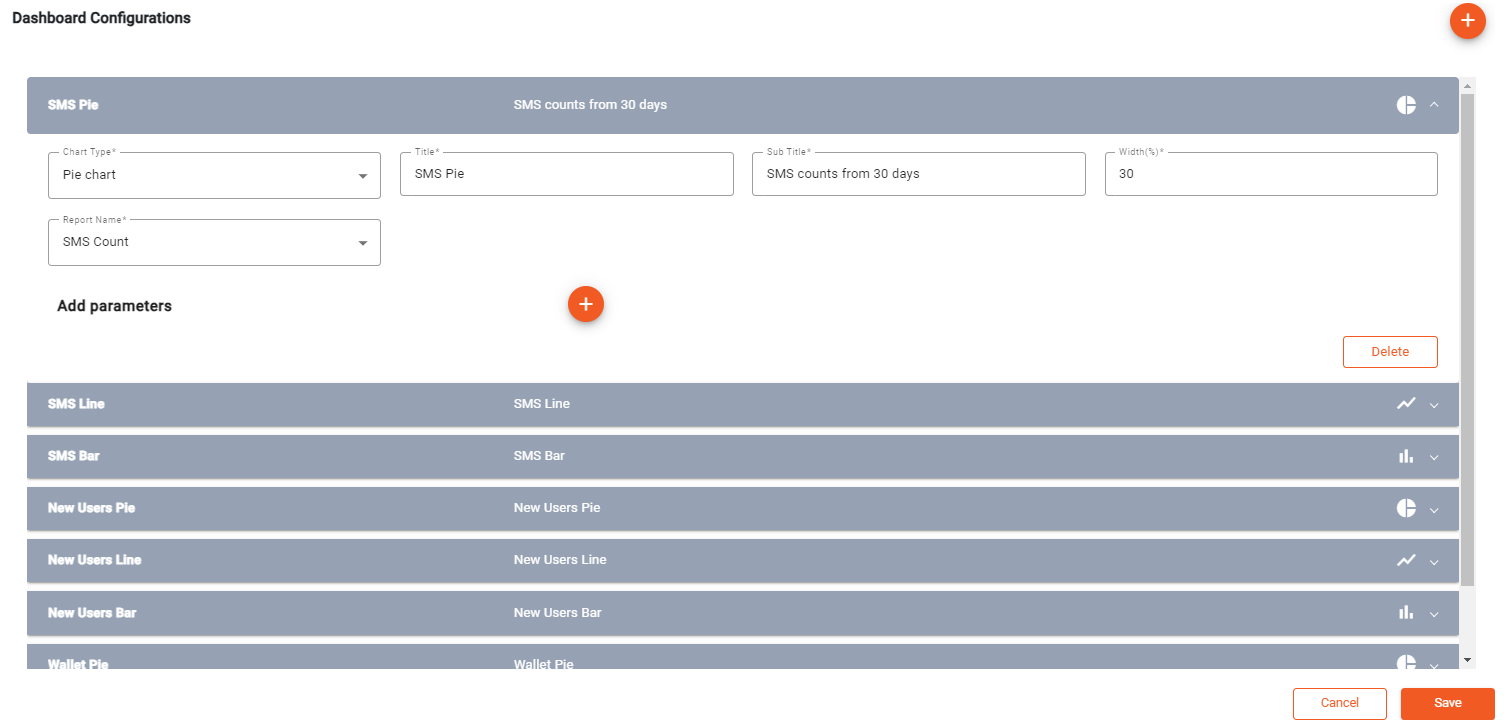
Configure dashboards
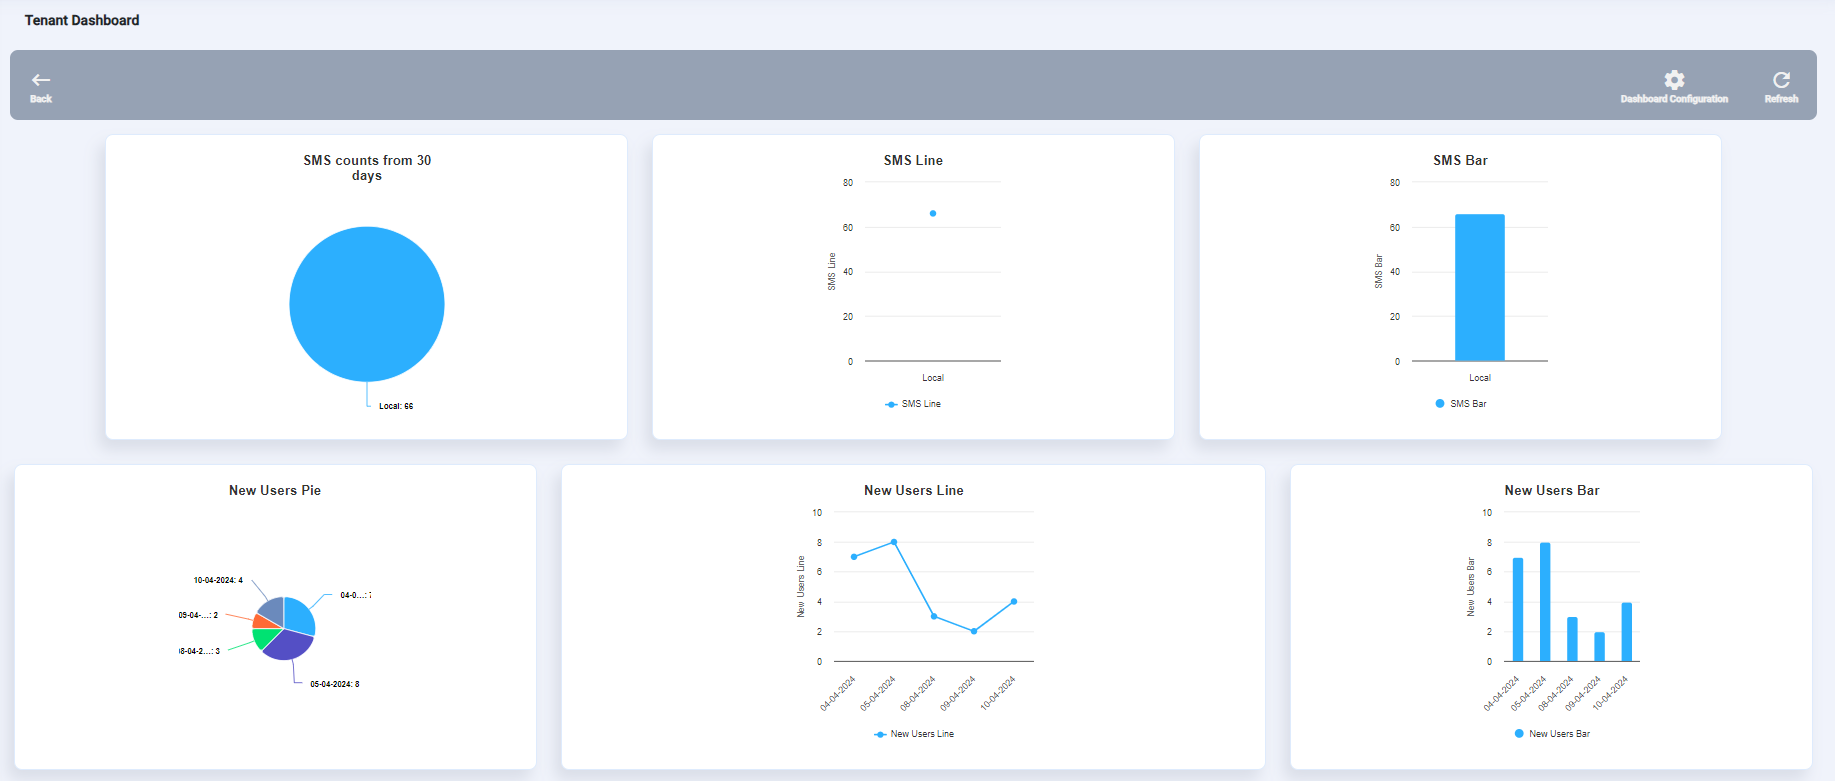
View dashboards
Dashboard configuration
The available dashboard sources is controlled by property dashboard.reports.config. This is set at a global level and can be overridden at a tenant level:
[
   {
      "id":"SMSCount",
      "name":"SMS Count"
   },
   {
      "id":"NewUsers",
      "name":"New Users"
   },
   {
      "id":"WalletBreakdown",
      "name":"Wallet Breakdown"
   }
]
Dashboards should be configured through the Eclipse Admin Portal - the resulting configuration is stored as tenant configdashboardChart:
[
	[
		{
			"width": 30,
			"reportName": "SMSCount",
			"chartType": "pieChart",
			"subTitle": "SMS counts from 30 days",
			"title": "SMS Pie",
			"yaxisTitle": "SMS Pie",
			"reportNameConfig": [],
			"index": 0
		},
		{
			"width": 30,
			"reportName": "SMSCount",
			"chartType": "lineChart",
			"subTitle": "SMS Line",
			"title": "SMS Line",
			"yaxisTitle": "SMS Line",
			"reportNameConfig": [],
			"index": 1
		},
		{
			"width": 30,
			"reportName": "SMSCount",
			"chartType": "barChart",
			"subTitle": "SMS Bar",
			"title": "SMS Bar",
			"yaxisTitle": "SMS Bar",
			"reportNameConfig": [],
			"index": 2
		},
		{
			"width": 30,
			"reportName": "NewUsers",
			"chartType": "pieChart",
			"subTitle": "New Users Pie",
			"title": "New Users Pie",
			"yaxisTitle": null,
			"reportNameConfig": [],
			"index": 3
		},
		{
			"width": 40,
			"reportName": "NewUsers",
			"chartType": "lineChart",
			"subTitle": "New Users Line",
			"title": "New Users Line",
			"yaxisTitle": "New Users Line",
			"reportNameConfig": [],
			"index": 4
		},
		{
			"width": 30,
			"reportName": "NewUsers",
			"chartType": "barChart",
			"subTitle": "New Users Bar",
			"title": "New Users Bar",
			"yaxisTitle": "New Users Bar",
			"reportNameConfig": [],
			"index": 5
		},
		{
			"width": 30,
			"reportName": "WalletBreakdown",
			"chartType": "pieChart",
			"subTitle": "Wallet Pie",
			"title": "Wallet Pie",
			"yaxisTitle": null,
			"reportNameConfig": [],
			"index": 6
		},
		{
			"width": 30,
			"reportName": "WalletBreakdown",
			"chartType": "lineChart",
			"subTitle": "Wallet Line",
			"title": "Wallet Line",
			"yaxisTitle": "Wallet Line",
			"reportNameConfig": [],
			"index": 7
		}
	]
]
Updated 9 months ago